Usage
The dashboard tracks request volume, token usage, and cost for your API keys. This page documents the fields the dashboard reports and the API surfaces behind them, so you know what is measured when you monitor or budget your usage.
This page covers model API usage. For Training API, Inference API, and LLM as a judge service scope and solution pricing inquiries, see Mint Recursive → Service Pricing. Model unit prices remain in the dashboard's Models & Pricing.
Tracked metrics
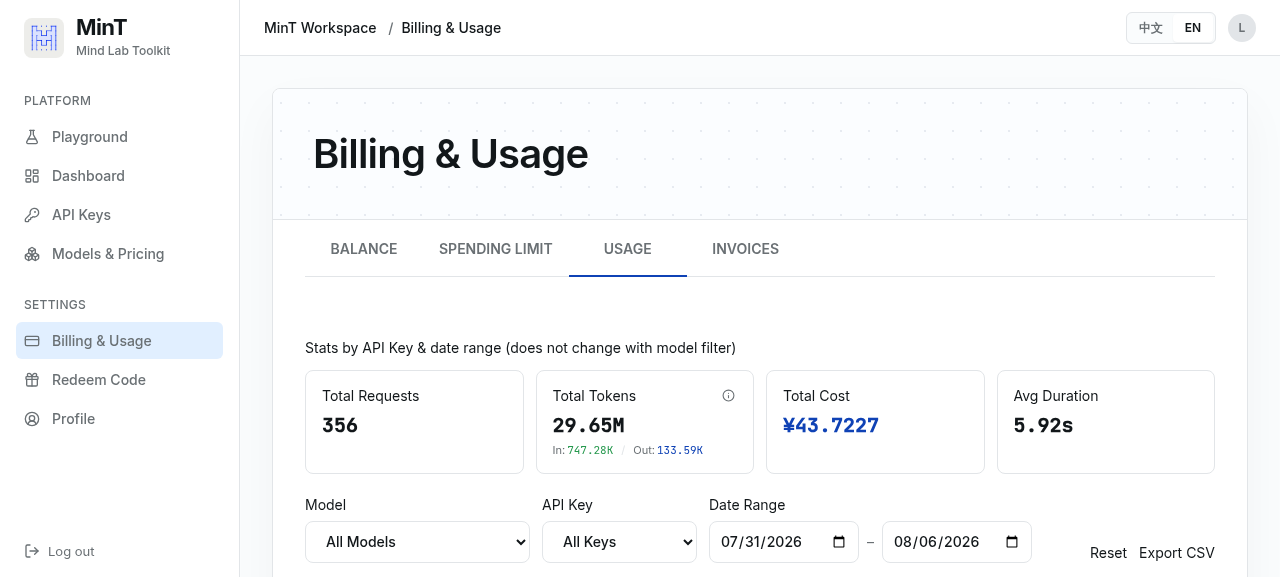
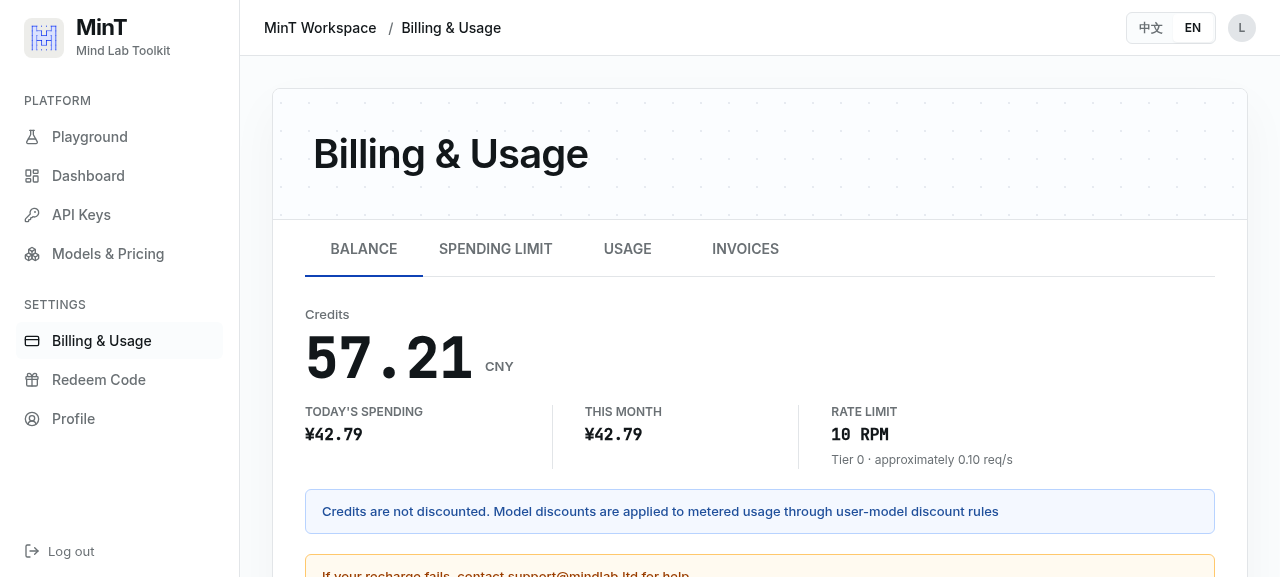
| Field | Description |
|---|---|
| Total requests | Cumulative request count across all keys. |
| Today requests | Request count in the current day (server timezone). |
| Input tokens | Prompt tokens billed at the model's input rate. |
| Output tokens | Generated tokens billed at the model's output rate. |
| Cache creation tokens | Tokens written to the prompt cache (cache write). |
| Cache read tokens | Tokens served from the prompt cache (cache read). |
| Total tokens | Sum of input + output + cache tokens. |
| Cost | Billed cost at the model's list rate. |
| Actual cost | Cost after effective rate multipliers (group/model discounts). |
| RPM | Requests per minute. |
| TPM | Tokens per minute. |
| Average duration | Mean request latency in milliseconds. |
| Active API keys | Keys that have made at least one request. |
| Total API keys | All keys on the account. |
Cache-read tokens are billed at a lower rate than input tokens (see model unit prices). The distinction between cost and actual cost reflects per-model rate multipliers applied after the list price.
API surfaces
The dashboard reads from two endpoints under your base URL:
GET /api/v1/usage/dashboard/stats— aggregate totals and today's figures (requests, tokens, cost, RPM/TPM, average duration, key counts).GET /api/v1/usage/dashboard/models— per-model breakdown of the same metrics.
Both require a bearer token from the dashboard login (not an API key). They are read-only and intended for the dashboard UI. For programmatic monitoring, query the same fields your dashboard displays.
Monitoring and budgeting
- For budget tracking, watch
actual costrather thancost— it reflects what you are billed after discounts. - Cache-read tokens reduce cost: a high cache-read ratio means prompts are hitting the prompt cache. Tune prompt prefix stability to raise this ratio.
- RPM and TPM are bounded by your account's rate limit and concurrency quota, which are visible in the dashboard. Contact support to raise limits.